Interpreting yDNA Test Results
Contents
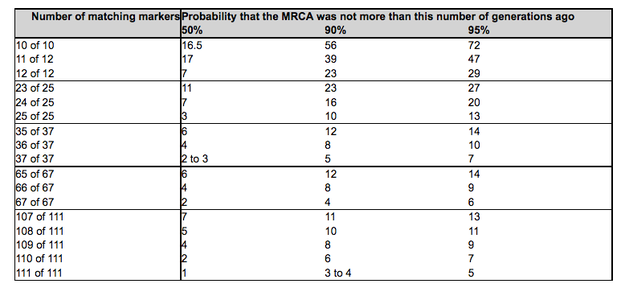
1. Introduction There are two types of basic yDNA tests: STRs and SNPs (pronounced "snip"s). An analogy is that STRs identify the leaves of a tree, while SNPs identify the twigs and branches. STRs are liable to relatively frequent mutations, whereas SNP mutations are much more stable. ySTR tests and ySNP tests complement one another. However the first test is always a STR test, and beginners can ignore SNP tests. 2. STR test results FTDNA publish the results of an STR test in a confidential on-line webpage from which a paper certificate can be downloaded. The results, commonly known as the testee's haplotype or genetic signature, comprise a number of markers, typically 37, mostly identified by a "DYS" number, and a count of the number of times these markers are repeated, known as the marker count. The yDNA STR test result of a single participant is of little value until it is compared with that of another participant. From such comparisons the probability of the two participants sharing a common ancestor can be assessed. Clusters or groups of participants sharing a common ancestor within the surname era, typically the last millennium, are known as genetic families. While determining the marker counts that make up a genetic signature is a strict scientific process, determining and expressing the probabilities of the comparisons of genetic signatures sharing a common ancestor is still a developing art. The probabilities are complex mathematical functions dependent on many variables, including the number of markers tested, the number and magnitude of the mismatching markers, and the different rates of mutation of individual markers (slow mutating markers are useful for grouping participants’ results, fast mutating markers for differentiating between results). And some assumption is needed of the possible number of generations elapsed since the most recent common paternal ancestor (MRCA). Several tools may be used to assess comparisons of two participants' genetic signatures; these include: 2.1 Haplogroups, the DNA signatures associated with basic ethnic groups used in Deep Ancestry Studies. FTDNA predict the relevant haplogroup from each genetic signature. Participants with different haplogroups are not genealogically related within the surname era. NB Haplogroup predictions can be confirmed by SNP ("snip" tests - see section 2 below) 2.2 Number of matching markers. This simple indicator can be used to give a rough indication of the probability of the number of generations since the two DNA signatures shared a common ancestor. The following table is from FTDNA's former faq512: To place these numbers of generations in context, it is unlikely the surname Irwin existed more than about 24 generations ago. This is only a very rough guide. As will be seen, our Study includes two brothers who have only 23 of 25 matching markers, while we have about two dozen participants with 37 of 37 matching markers, of whom half also have 67 of 67 matching markers, none of whom have been able to use this study to determine their genealogical relationship (unlike several other participants with non-identical, albeit close, genetic matches who have succeeded in identifying genealogical relations). These examples illustrate that the mutations of individual markers is a random process. 2.3 Genetic distance. This is the simplest measure. Genetic Distances are expressed in terms of the differences between each marker, in terms of the number of markers compared, e.g. ‘0/12’ or ‘1/37’. There are various models for calculating genetic distance. FTDNA now calculate Genetic Distance as the sum of the differences of individual marker counts, e.g. a distance of 3 may include three 1-step mismatches, or one 2-step mismatch plus one 1-step mismatch. NB Different rules apply for multi-copy marker such as DYS 385, 389, 464 and YCA: see https://dna-explained.com/2016/07/27/y-dna-match-changes-at-family-tree-dna-affect-genetic-distance/ 2.4 Time since Most Recent Common Ancestor (TMRCA). Tables and graphs may be used to convert Genetic Distance into the number of generations since two participants shared a common ancestor. While this measure is expressed in years it is readily comprehensible, and is a powerful tool for deep ancestry studies, alas the margins of error are so great that it is a most unreliable tool when used within the surname era. And like the number of matching markers and Genetic Distance and TMRCAs they are also unreliable because they assume some single average mutation rate for all markers, while in practice the average mutation rates for individual markers vary enormously. 2.5 FTDNA’s ‘TiP’ probability. These are a tool that encompass a large number of variables in a single probability figure. Unlike Matches, GDs and TMRCAs they take account of differing average mutation rates of individual markers, and respond to "resolution" (i.e. the number of makers analysed): as the resolutions is increased from 12 to 37 to 67, so the TiP probabilities of common ancestry of two participants tend to polarise towards 0% or 100%. But there are many exceptions to this generalization, and 12-marker TiP %s are particularly unreliable. The number of generations since a possible MRCA is also important. For most people with the same or similar surnames this is typically a maximum of 24 generations. Coincidentally this is the number of generations since the Irwin traditions of the time of Robert the Bruce. TiP probabilities reduce if genealogical research has shown the common ancestor must have been more than, say, 8 generations ago. FTDNA's TiP tool is powerful but complex and, amongst geneticists as its content is commercially confidential, controversial. But it represents FTDNA's best understanding of the impact of differing averatge mutation rates. This Study uses a single TiP parameter, the 24-generation, no-paper-trail TiP ot the highest available resolution, known as the TiP Score, as an arbitrary tool to assess relative probabilites of individual participants sharing a common ancestor with a modal participant. When two or more participants with the surname Irwin or similar are found to be “closely matched” (defined in this Study as having a TiP Score of over 60% (formerly a TiP of over 80%) - see Appendix C of the accompanying Supplementary Paper No.1 ("Towards Improvement .... ), they can be grouped together as members of a “genetic family”. The participant having the genetic signature that is most common within each genetic family is known as the modal participant. The genetic signature of the modal participant may have the modal signature of the common ancestor of the genetic family, but this is not necessarily so. Participants with the surname Irwin or similar who do not closely match any other participant are known as "Singletons". Participants with other surnames who have a "match" with one or more Irwins etc but a TiP Score of less than 60% are considered to be Mismatchesknown as "False positives" and not included in the Study statistics. Participants with other surnames whose yDNA Matches shown on their FTDNA personal page are all or nearly all Irwins (or similar) are known as "NPEs" (see below), as are participants with the surname Irwin (or similar) but whose yDNA Matches on their FTDNA personal page are nearly all some other particular surname. 2.6 NPEs. In practice surnames did not always pass through the male line, and in Surname DNA studies instances of such events are euphemistically termed as Non Paternal Events. Examples of NPEs include:
Awareness that one's paternal ancestry included a NPE can be disappointing, particularly to genealogists who have long believed they are descended from a particular branch of their surname. But it is important to remember that a majority of NPE's were not associated with any untoward event, that most surnames are not derived from a single ancestor, that DNA studies are never 100% proof of anything, and that some NPE branches of a surname may be older than branches that are not NPEs. The heritage of a surname can be shared by all its branches. For inspiring examples of how genealogical research can resolve NPE test results see the accompanying Supplementary Paper No.8 and, if you can get hold of a copy, Richard Hill's fascinating book Finding Family. 2.7. Singletons, Mismatches, False Positives and Convergence/Back mutations. Participants with the surname Irwin or similar who do not closely match any other participant are considered to be "Singletons". Participants with a surname dissimilar to Irwin who have a close match with an Irwin at low STR resolutions who fail to make the TiP Score 95% cut-off at higher STR resolutions, or whose SNP test results are not compatible with Irwin participant with whom they otherwise match, are termed False Positives. False Positives are one example of Convergence, a term used in genetic genealogy to describe the process whereby two different genetic signatures have mutated over time - experienced "back mutations" - to become identical or near identical, resulting in an accidental or coincidental match. Many of the "Matches" identified on the FTDNA YDNA "Matches" web pages which have different surnames can be explained by convergence. 2.8 Caution. Prospective participants should therefore be aware that some DNA test results have unexpected implications. Disappointments can occur for several reasons: • if there has been a NPE in the paternal ancestral line; • if the results contradict some cherished genealogical research or tradition; • if there has been a mutation in recent generations and two known relatives have different DNA signatures (while most fathers, sons, brothers and first cousins have identical DNA signatures, a few have mismatches of 1/37 or even 2/37); • if the comparisons are indeterminate, e.g. if a participant appears genetically unrelated to anyone else in the study; • if the test does not lead to identifying any "new" genenealogical relatives (because few surname DNA studies have sampled more than 1% of those with the surname who are alive today ). Notwithstanding these contingencies over 90% of participants in our Study have been shown to be in one of the various genetic families that have been identified. 3. SNP test results and haplotrees 3.1 SNPs. SNPs (pronounced "snip"s) are another form of analysing yDNA samples. An analogy is that STRs identify the leaves of a tree, but SNPs identify the twigs and branches. STRs are liable to relatively frequent mutations, whereas SNP mutations are much more stable. ySTR tests and ySNP tests complement one another. The nomenclature of SNPs and their context can be confusing. SNP tests are identified by an alphanumeric such as L21 or L555. The prefix letter “L” indicates these were identified by FTDNA (who confusingly also use the prefix BY). Other organizations use different prefixes (for those curious about these prefixes see www.isogg.org/tree). Confusingly many SNPs have synonyms, e.g. L21 = M529, L555 = S393. Seefor ybrowse.org a full list of SNPs with their synonyms and locations on the human genome. A further nomenclature challenge is the meaning of terms such "known SNPs", "private SNPs" and "terminal SNPs", not least because as more and more SNPs are discovered these labels will change. Private SNPs are sometimes used to relate to those specific to a surname, and terminal SNPs to the youngest known SNP. Because of lack of definition and the inherent instability of these terms I prefer not to use them, though the relative terms upstream SNPs and downstream SNPs is sometimes useful - see below. SNP test results are very different from STR test results. In single SNP tests and (multiple) SNP Pack tests the saliva sample simply tests positive or negative, e.g. L555+ or L555-, i.e. it is binary, and not probablistic. For more details of SNP tests see Supplementary Paper 5. 3.2 Haplotrees. All SNPs can be placed on a haplotree (aka phylogentic tree), a genetic family tree that goes back to the genetic Adam. Until recently haplotrees were mainly relevant to genetic anthropologists and others interested in Deep Ancestry studies, and their relevance to genetic genealogists in general and to this Study in particular had been very limited. However since about 2010 SNPs and haplotrees have become increasingly relevant to genetic genealogists as more and more SNPs are discovered and halpotrees expand downstream towards and now even into the surname era, i.e the last millenium. As SNPs are being discovered so frequently (and their relationships to one another occasionally revised) that there alas is no single, up-to-date haplotree, and if there was it would be too cumbersome to replicate graphically. Several haplotrees are relevant to this Study: - FTDNA's haplotree (at their personal webpage/account under Y-DNA > Haplotree & SNPs) used to be very outdated, but since spring 2016 has been much more comprehensive, expecially for SNPs they have "discovered" themselves. SNPs that have tested positive are shown in green, SNPs that have tested negative are shown in red. NB On FTDNA's public pages (e.g. https://www.familytreedna.com/public/irwin/default.aspx?section=yresults) (and on the main results table of this Study), haplogroups confirmed by SNP testing are shown in green, haplogroups predicted from STR data are shown in red. - ISOGG's haplotree (at www.isogg.org/tree) is more comprehensive but less up-to-date and excludes many downstream aka Private SNPs. Like the FTDNA haplotree this is presented as a table, with the oldest SNPs on the left, the younger "sons" and "grandsons" successivly indented towards the right. - Alex Williamson's excellent Big Tree (at www.ytree.net) is resticted to P312 and its downstream SNPs (including L555), but includes few SNPs identified by SNP Pack tests. This haplotree is presented more like a conventional family tree, with the oldest SNPs at the top, and successive "sons" and "grandsons" below. - The Clan Irwin haplotree (at LATEST ANALYSIS UPDATE) is edited (in BigTree format) to show only the haplotree branches relevant to the 30+ Genetic families identified in this Study. This includes the Border Irwin L555 SNP, but no details downstream thereof. - The Border Irwins L555 haplotree (a downstream amplification of the Clan Irwin haplotree) is now shown in two formats: (1) within the Master Results table in the LATEST RESULTS TABLE (FTDNA format), and (2) in the Border Irwins section of LATEST ANALYSIS UPDATE (BigTree format). The position of a SNP on a haplotree may be indicated in various ways, thus L21 may be termed R-L21 or R1b-L21, where R is the haplogroup and R1b is the sub-clade. Or some call R1b the haplogroup and R1b1a2a2a1a2c the sub-clade that defines L21. The latter hierarchical form is logical but both clumsy and liable to be changed, so more descriptive forms such as R>M343>M269>P312>L21 are now more popular. Thus L555 may be termed R1b>M343>M269>P312>L21>Z251>L555, or simply as R1b-L555, or some intermediate description if preferred. Note that the number of true generations separating each "son"/"grandson" on a haplotree will vary greatly, depending on when a relevant mutation occurred. On average one SNP occurred every 120 years, or about every 4 generations, but individual mutations may be separated by one generation or by 20 or more generations. TMRCA's based on individual branch lines are thus unreliable, but are likely to be more accurate if averaged over several branches. 4. Next Generation Sequence (NGS) e.g. BigY test results These tests are expensive and complex. They give much more comprehensive STR and SNP, but on a probablistic basis. For details see Supplementary Paper 5. 5. Further guidance on understanding test results See www.isogg.org/wiki. |
Geneology
Background and Goals Main Findings Joining the Study Interpreting yDNA Test Results LATEST RESULTS TABLES LATEST ANALYSIS UPDATE CHOOSING FURTHER TESTS / GENERAL FUND Administrative Matters Supplementary Papers 1. Towards Improvement in yDNA Surname Project Administration 2. Irwin Surname Statistics 3. Identifying sub-groups in the Borders Family 4. Interpreting Drum's DNA Test Results 5. More on L555 SNP and BigY Tests 6. Trifold 7. Genealogical Background 8. A DNA NPE Success Story 9. Lecture slides 10. Irvine Clan Autosomal DNA Project Sitemap |
